
Interested in this project?
Continue LearningIntroduction
A cryptocurrency backtester. Sounds complicated? Well, they can be, but they can also be really simple. Like, under 100 lines of Python simple! That’s what we’re going to be exploring today.
What is a backtester?
Imagine you came up with a set of rules dictating when you should buy or sell a particular digital asset or stock -- an investment strategy. Let’s say that you did some research and found that digital assets go up in value when their average price over the past three days surpasses their average price of the last five days (simple moving averages strategy). Would you automatically trust that this strategy you came up with is totally correct and used it with your own money? I should hope not. Before you employ an investment strategy, you ought to test it. A popular method of testing investment strategies to determine if they will work is seeing how they perform when given data from the past -- backtesting.
A backtester is any program that can feed historical data through the rules you came up with and manipulate a fake portfolio based on these rules so you can see how your strategy would have performed in the past.
For making our backtester, we will be using Python 2.7 and a few libraries (matplotlib, requests, json).
Getting Started
We will design our crypto backtester as a terminal-based application. It will ask the user for some basic info such as what digital asset to measure, initial investment, and strategy, and the program will then gather some historical data and then run it through our backtester to produce a chart of our portfolio value over time.
Let's create a new file called backtester.py.
Let's import our modules. We will be matplotlib to plot our graph and requests and json to fetch our data.
import matplotlib.pyplot as plt
import requests, json
Let’s write our first function -- our start() function. This function will be called at the start of our program and will ask the user for some data and then use that to determine what currency and strategy to use for the backtester.
We need to get the raw_input for the following variables:
- ticker
- initial investment
- investment strategy
Therefore, we'll first get the ticker from the user and fetch the data from the CryptoCompare API using the requests library (we are fetching minutely data (past 2000), but you may experiment with the API as you wish).
After fetching the data, we'll pass the data, initial investment and strategy values into the moving_averages() function which we'll write next. If you wanted to add another strategy, you could simply add a selection for it (ex. if strategy == "2")
def start():
    """
    Here we ask the user for some basic input, fetch our historical data and determine what strategy to use.
    """
    print "Starting Crypto Backtester V1"
    ticker = raw_input("Enter ticker: ").upper()
    data_url = 'https://min-api.cryptocompare.com/data/histominute?fsym=' + ticker + '&tsym=USD&limit=2000&aggregate=1'
    response = requests.get(data_url)
    try:
        data = response.json()['Data']
    except:
        print "Sorry, this crypto isn't supported!"
        quit()
    historical_data = data
    print "Fetched historical data for crypto: " + ticker
    cash = raw_input("Enter initial investment: ")
    strategy = raw_input("Select (1) for the moving averages strategy: ")
    if strategy == "1":
        moving_averages(historical_data, ticker, cash)
Now, let's define the moving_averages function. We'll store the initial investment in the initial variable and convert both the initial and cash variables to integers. We then can define the crypto variable to have a value of 0 and define our x and y values as empty arrays.
Now, we start looping through the historical data (starting from index 5 just to be same with the averages). We can then calculate the three and five day averages by passing the data points as an array into the get_average function which we will define after.
After we get the averages, we compare them to figure out whether we want to buy or sell the asset. If the three day average is greater than the five day average (short-term MA crosses long-term MA), it could indicate a trend of shifting up, and so it is a buy signal. If the five day average is greater than the three day average (long-term MA crosses short-term MA), it indicates a trend of shifting down, and so it is a sell signal.
If there is a “buy” signal, the asset is bought using half of the portfolio’s available cash. The “buy” process simply subtracts the cash from our cash holdings and divides it by the current price of the currency to see how much of the asset should be added in the portfolio.
If there is a "sell" signal, half of our asset holdings are sold (think, convert half of the number of crypto we have to cash).
At the end of each iteration, it calculates how much our portfolio is worth and appends an x (where we are in the list of minutely data points) and y value (the portfolio value) to our x_values and y_values.
Lastly, we can call the plot_graph() function and determine our profit/loss.
def moving_averages(historical_data, ticker, cash):
    """
    If the 3 day average price of ETH is above the 5 day average price, buy. If below, sell.
    """
    initial = int(cash)
    cash = int(cash)
    crypto = 0
    x_values = []
    y_values = []
    for place, data_set in enumerate(historical_data[5:-1]):
        three_day_average = get_average([historical_data[place-1], historical_data[place-2], historical_data[place-3]])
        five_day_average = get_average([historical_data[place-1],
                                       historical_data[place-2],
                                       historical_data[place-3],
                                       historical_data[place-4],
                                       historical_data[place-5]])
        if three_day_average > five_day_average:
            cash_used_to_buy = cash/2
            price = float(data_set["close"])
            number_of_crypto_we_just_bought = cash_used_to_buy/price
            crypto += number_of_crypto_we_just_bought
            cash -= cash_used_to_buy
            print "Just bought: " + str(number_of_crypto_we_just_bought) + " " + ticker
        if crypto > 1 and three_day_average < five_day_average:
            price = float(data_set["close"])
            number_of_crypto_being_sold = crypto/2
            new_cash = number_of_crypto_being_sold * price
            cash += new_cash
            crypto -= number_of_crypto_being_sold
            print "Just sold: " + str(number_of_crypto_being_sold) + " " + ticker
        portfolio_value = cash + (crypto * float(data_set["close"]))
        x_values.append(place)
        y_values.append(portfolio_value)
    print "Final portfolio value: " + str(portfolio_value)
    net = portfolio_value - initial
    if (net > 0):
        print "You profited: " + str(net)
    else:
        print("You lost:  ") + str(net)
    plot_graph(x_values, y_values)
Before we finish, we need to define two more functions. Here's our get_average function:
def get_average(averages_list):
    """
    Gets the average of some numbers
    """
    total = 0
    for data_set in averages_list:
        total += float(data_set["close"])
    return total/len(averages_list)
There isn’t too much to explain here -- it simply takes a list of inputs, gets the average and returns it.
After we are finished backtesting, our backtest function calls the plot_graph() function:
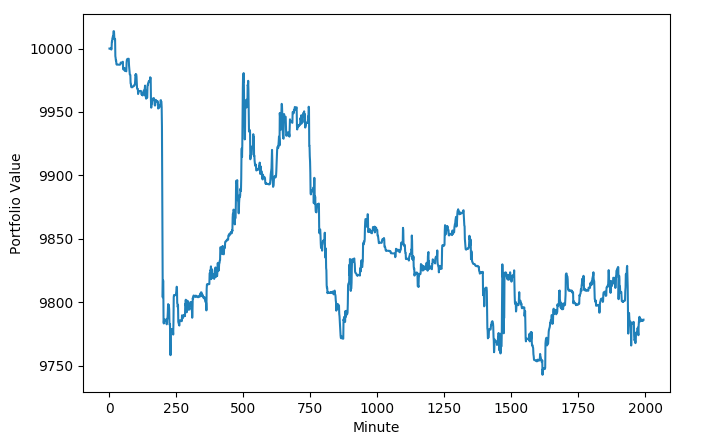
def plot_graph(x, y):
    """
    Plots our Graph
    """
    plt.plot(x, y)
    plt.xlabel("Minute")
    plt.ylabel("Portfolio Value")
    plt.show()
We have defined all of our functions. Now all we have to do is call the start function in the last line of our file:
start()
Here you should see a graph of your portfolio’s value over time. Here's one with Bitcoin and an intial investment of $10,000. (Yes, I lost money :D)
And there you have it: a simple digital asset backtester in under 100 lines of python. Feel free to add more strategies or maybe even a GUI. It's all yours!
About the Author
Owen is a high school senior and full stack developer. He currently works on Grand Street Technologies.
Comments (0)