
Interested in this project?
Continue LearningIntroduction
In today's online world, it can sometimes be difficult to discern whether the news you're reading is likely true or not. What if you had a model that could tell you if that article you think is real is actually fake news?
In this tutorial, we'll be building a text classification model using the Naive Bayes classifier. Our data will come from the fake and real news dataset on Kaggle. By the end, you'll have your very own machine learning model trained on a vast dataset to recognize when news might not be authentic. Let's dive in!
Disclaimer: This model we'll be building is a super simplified representation of classifying news stories and definitely should not be used to draw firm conclusions. Data is crude and often biased, and it's important to be wary of that.
Suggested Dependencies
This tutorial will cover some concepts in probability and we will be coding in Python using a notebook (.ipynb) environment such as Jupyter or Google Colab. Familiarity with both would be helpful, but is not a necessity. Coding in a regular Python (.py) file works just as well! If you are not in an Anaconda environment, install the following packages using these commands in your terminal:
pip install pandas
pip install -U scikit-learn
In Anaconda, run these commands (though you likely will already have them installed)
conda install pandas
conda install scikit-learn
Intuition
In this section, let's cover what a classifier is, what Naive Bayes is, and some of the assumptions we'll be making in order to build this project.
Classification
In machine learning, classification refer to a type of predictive modeling where the model attempts to predict the labels for a set of input data. The simplest example of this is spam filtering in your email inbox. An algorithm sorts incoming email by analyzing their text (something we're going to get into in just a bit) and decides whether or not to put it in your inbox or your junk by appropriately labeling each email. Here's another representation:
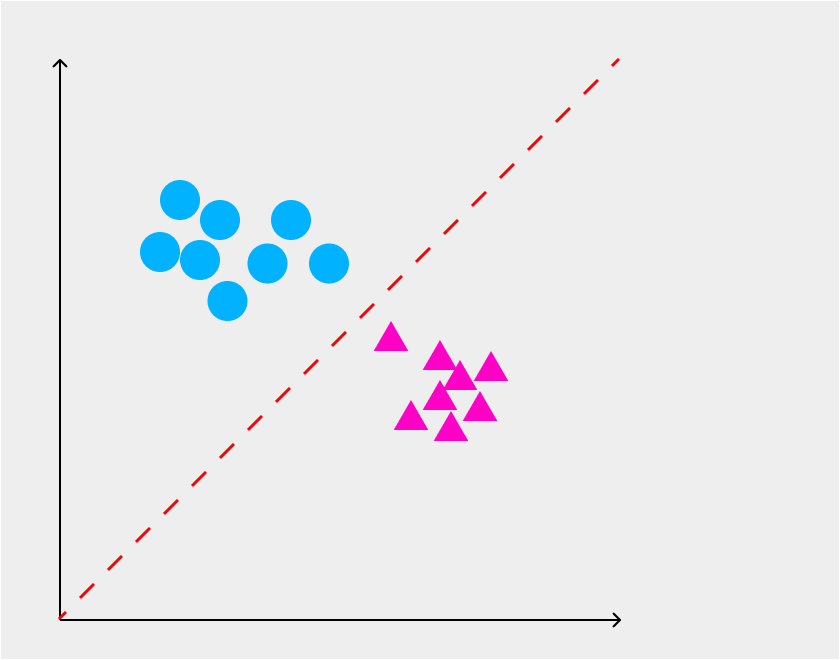
The red dotted line is the algorithm that splits the two categories up. In this tutorial we'll be doing the same thing, but with news stories!
The Bag of Words Model
In order to classify news as fake or not, our model needs a vocabulary. This is where our bag of words comes in. In this project, we'll be using sklearn's CountVectorizer in order to convert our text into a dictionary that maps every unique word to the number of times it appears in the data. This feature extractor will also convert the words into vectors that we can fit to our model.
Think about it this way: your brain generally finds patterns in the language of spammy emails versus ones that are actually important to you. You have a bag of words for the emails that tend to end up in your inbox, and another separate bag for those that go to your spam. Our model works the same way!
Bayes' Theorem
Bayes is a big name in probability as well as in machine learning! In this project, our classifier is called Naive Bayes and it's based on Bayes' Theorem. It looks like this:
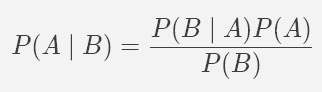
Okay, this might confusing to look at, so let's start with the idea of conditional probability, which we'll define in the following way:
The likelihood of event A happening given event B does happen.
Cool, so you might already be able to see how this plays into the theorem. Bayes Theorem calculates the probability that A is true given event B based on the inverse probability, probability of B given A. If you want to learn more about it and see a derivation, I highly suggest researching the law of total probability, but it's a bit beyond the scope for what we need to know for this project.
Naive Bayes & Assumptions
We've almost got all of the understanding we need to know. The last thing we are going to talk about is our classifier and the assumptions we'll be making. The Naive Bayes method for text classification is very popular because it scales very easily. But what is it, and why do we call it naive? Well, Naive Bayes assumes conditional independence between every pair of features. For our project, this means we are assuming that the words in a news article have no impact on each other; we are only examining the probability of seeing each word given a fake or real news story. You might be starting to see why this is a naive assumption. A sentence is not just an independent jumble of words. The words build off and on top of one another. Let's take a hypothetical sentence as an example:

For our classifier, we assume the above equation to be true. However, in real life you know that sentences aren't formed this way. Let's keep this in mind when we get to modeling, but for now let's get started with our dataset!
Importing and Cleaning
We'll be working with the fake news dataset from Kaggle. Download both sets of data and place them in the same folder as your notebook or python file. I am going to call mineexploration.ipynb. If you're not working in Jupyter or Colab, your extension will just be .py.
Optional: Google Colab
If you're working in a Google Colab notebook, you'll have to mount it to your drive. Run this in your notebook:
from google.colab import drive
drive.mount('/content/drive/') # you will need to authenticate
# cd into the directory where your data is stored, for me it's the My Drive folder
cd My\ Drive/  # use the %ls command to figure out what directory you're in
Before we load in our data, we have to import the pandas library to read it as a DataFrame object.
import pandas as pd # calling it pd is convention
Now let's load in the Fake.csv and True.csv datasets!
# loading in our two datasets..we'll combine them later on
# if you load in the data set as I do, they'll need to be placed in the same directory
fake = pd.read_csv("Fake.csv")
true = pd.read_csv("True.csv")
It's a good idea to take a peek at the first few rows of both dataframes to see what we're dealing with, so let's use the .head() function.
true.head()
# load in fake in a separate cell
fake.head()
Great, we see each entry has a title, text, a subject, and date published. However, the only way we can tell which stories are fake is by which dataset it is in. Since we're going to be concatenating the dataframes later on, let's put a flag in as a feature to both dataframes
# setting entire column to 0 so when we concat the dataframes we know which were real and which were fake
# In this case, the real articles are equal to 0
true["fake_news"] = 0
Now it's your turn! Create a column in fake that has all of its entries equal to 1.
Solution
fake["fake_news"] = 1
It also has to be called fake_news or else concatenation will not work.
We just created a brand new column in both dataframes and populated all of their entries with either a 0 or 1. Take a look if you don't believe me with the .head() function again.
Awesome, we're doing great already. We can already see that the subject column looks a little different between the two dataframes. Let's explore this some more.
# examine the unique article subjects
fake["subject"].unique()
I'll let you handle the other dataframe by calling the same function, .unique() again. It's interesting that there are many more categories in the dataframe with fake entries, and it might be a cool project to categorize what kind of news an article is, but that's not our goal right now.
Extracting Text in Pandas
You probably already noticed something different about the text column in the true dataframe. Let's take a closer look
just_text = true["text"]
just_text.head()
All of these articles start with a location and "Reuters" written at the start. If we trained on this data as is, the model would quickly learn that articles that have Reuters in them are true and so the rest aren't. So while we might be able to get a really accurate model that way, what about a real article that doesn't have Reuters in it? It would probably get classified as fake. The machine learning term for this is overfitting. Our model gets really good at practically memorizing the data it's given, but it's not very effective on data it either hasn't seen before or comes from outside the dataset.
Let's fix this by removing all of the starting information in order to make the text from both dataframes as similar as possible. To do this, pandas has a handy function called extractall() that accepts a regular expression (regex) pattern as an argument. Regex is a special sequence of characters that defines a search pattern. We're going to extract all of the text that comes after the hyphen that follows Reuters.
just_text = just_text.str.extractall(r"^.*? - (?P<text>.*)")
So what the heck is in the function? Let's do a quick crash course in regex. First we told pandas we want the strings in the just_text column, and then called extractall() on it. In the parenthesis, here's a quick guide to the syntax
| regex | meaning |
|---|---|
| ^ | only at the start of the string |
| . | any character |
| * | repeated 0 or more times |
| ? | make the expression non-greedy |
| ( ) | the text we actually want to capture |
| ?P<text> | name the column our text is extracted under to be called "text" |
We extracted the shortest possible string of text that came after a hyphen when the start of the string had any set of characters followed by a hyphen.
Here's a quick question for you. What are we expecting to catch with the pattern .*? that follows ?P<text\>?
Solution
All of the words that follow the hyphen i.e. the actual news article!
Amazing, now we have a new dataframe called just_text with all of our real news stories without the preceding markers. Imagine trying to change this for all 21,000+ entries manually? Thank you regex!
Even though we got the text out, the dataframe it created has multiple indices. This is a nuisance but we quickly take care of it like this:
just_text = just_text.droplevel(1)
Check your dataframe to see it's much nicer looking now.
The last step we have to take before we are ready to concatenate the dataframes is reassign just_text to the text column in our true dataframe. Pandas helps us again here with the .assign() function
true = true.assign(text=just_text["text"]) # switcharoo on the columns
Combining and Saving the Data
We're finally ready to concatenate the dataframes. Let's combine fake and true into a new dataframe called df
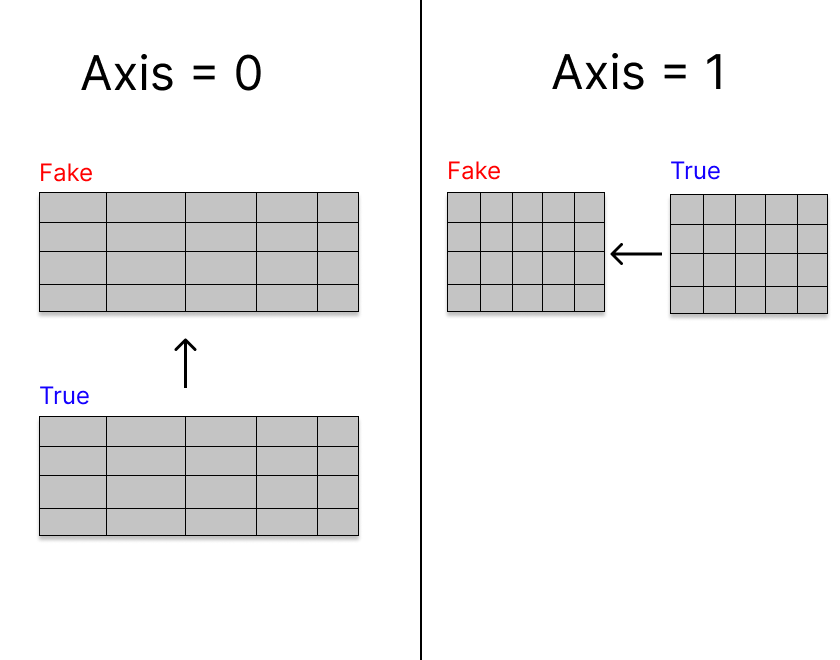
df = pd.concat([fake, true], axis = 0)
We choose to combine on axis = 0 because we want to stack the rows on top of each other. If we chose axis = 1, it would line the columns up together from left to right which isn't helpful to us.
 We no longer have a fake or true news dataframe, it's all in one large one. Luckily, we created a feature earlier on to help us determine which dataframe each entry came from. We don't any other columns though, so let's drop them.
df = df.drop(["subject", "date", "title"], axis = 1) # we won't use these columns in our model
This time we drop from axis = 1 because we want to remove columns.
Let's also check if we have any missing records and use the pandas function .dropna() to remove them.
df.info()
We can see that there a few entries missing from the text column. There must have been blank entries in parts of our original datasets. Try and call .dropna() to remove the rows with missing data. Think about what axis you want to work with too, but you technically don't need to specify an axis in this case.
Solution
df = df.dropna(axis = 0)
# axis defaults to zero, so I'm just showing off
We're ready to move to the next notebook file and do some modeling. Last thing we have to do is save the new dataframe as it's own csv file.
# save the cleaned csv for other modeling
clean_text = df.to_csv("cleaned_news.csv", index = False) # prevents having two indices
Training Our Classifier
Load In Clean Data
Create a new notebook called nb_model.ipynb in the same folder as your other files for this project. Try and import the pandas module as well as your cleaned dataframe. If you're using Colab, follow the same steps as we did in the exploration.ipynb notebook.
Solution
import pandas as pd
df = pd.read_csv("cleaned_news.csv")
df.head()
Naive Multinomial Bayes with sklearn
Let's begin setting up our classifier by splitting the data up into independent and dependent variables. In this case, what do you think our dependent variable is?
Solution
The fake news marker! It tells us which category the model thinks the story falls under. Let's create our X and y
# split the data
DV = "fake_news" # the dependent variable, text is the independent variable here
X = df.drop([DV], axis = 1) # drop from our X array because this is the text data that gets trained
y = df[DV]
Now let's start using our fun toolkit from sklearn. We'll begin by splitting our entire dataset up into testing and training portions. This is super important to do because we need to save a portion of our data to validate our text results on. We will train on 75% of the dataset and test on the remaining 25%. This goes back to the idea of overfitting we discussed earlier. We want to make sure our model performs well on data it has never seen before.
from sklearn.model_selection import train_test_split
# we train on 75% of the data, test on the rest
X_train, X_test, y_train, y_test = train_test_split(X,y, test_size=0.25)
Next we need to convert all of our words into the bag of words model from before using sklearn's CountVectorizer
from sklearn.feature_extraction.text import CountVectorizer

count_vect = CountVectorizer(max_features = 5000)# limiting to 5000 unique words, but room to play with this here!
X_train_counts = count_vect.fit_transform(X_train["text"])
# print(count_vect.vocabulary_) # here is our bag of words!
X_test = count_vect.transform(X_test["text"]) # note: we don't fit it to the model! Or else this is all useless
The count vectorizer does two things for us. First, it creates a bag of words by parsing all of the unique words in all of the text and mapping it to a dictionary where the value for each word is the number of times it appears. Then it transforms the text into a matrix (a bunch of vectors lined up next to each other) with each document and term. It's important to notice here that we do not fit X_test because we want our model to actually work on data it hasn't seen before. Print out X_train_counts or X_test if you're interested to see what this looks like!
Multinomial Bayes
Before we train our model, let's talk about what specifically the Multinomial Bayes classifier is. We are calculating Naive Bayes on a lot of words in all of the data. In our case, this means answering the question "What is the probability a particular word appears given that the article is true?" If you look at the formula for Bayes' Theorem, this is in part determined by the probability that the news article is true (or fake!) given that a particular word exists in it. This is repeated for every unique word in our vocabulary. The summation from all of these calculations and division by a normalization constant assigns the article to be real or not based on the result (a probability).
Pretty cool right? Now let's do it ourselves.
from sklearn.naive_bayes import MultinomialNB
# fit the training dataset on the NB classifier
Naive = MultinomialNB()
Naive.fit(X_train_counts, y_train)
We have our model! Sklearn spares us from doing the math oursevles today, but it's extremely valuable that we understand what we're doing rather than slinging every tool in the shed at our data. Let's have the model make predictions on the testing portion of the data and take a look at how accurate it is using a handy sklearn tool called accuracy_score.
from sklearn.metrics import accuracy_score
# predict the labels on validation dataset
predictions_NB = Naive.predict(X_test)
# Use accuracy_score function to get the accuracy
# very accurate bc of assumption of independence!
print("Accuracy Score:",accuracy_score(predictions_NB, y_test)*100)
When I did this, my model consistently achieved ~93% accuracy, which seems pretty good to me! There's a lot of hyperparameter tuning we can do on this to make it better, but I encourage you to do that on your own and share what you can do! Just remember to think like a data scientist when deciding on different approaches to refine the model.
Putting It to The Test!
The Onion
The Onion is a satirical newspaper that publishes stories that make fun of our local, national, and international news. By all metrics, these stories are not real. Let's see if our classifier thinks the same way.
# real life article prediction
# link: https://entertainment.theonion.com/drake-fans-accuse-kenny-chesney-of-manipulating-billboa-1843484082
onion = ["""Calling the country singer’s place at the top of Top 200 completely illegitimate, fans of the
            rapper–singer Drake took to social media Friday to accuse Kenny Chesney of manipulating Billboard’s
            algorithm by putting effort into his album. “It’s just unfair that this guy could keep Drake from his
            rightful place on the charts by putting out quality music that he actually cares about,” said Aiden
            Howard, 14, who echoed the sentiments of Drake fans worldwide in his assertion that the artist’s
            mediocre B-sides deserved more acclaim and recognition. “He clearly gamed the streaming numbers when
            he decided to put time and energy into his craft. It’s such horseshit that Billboard rewards that
            behavior and punishes Drizzy for making a half-assed mixtape full of songs he’d already dropped on
            SoundCloud. How the hell is ‘Toosie Slide’ going to compare to a song that the artist thought about
            for more than 15 minutes?” At press time, Drake released a statement asking fans to ignore Kenny
            Chesney and focus on the horseshit that he just released."""]
Like before, let's vectorize the text and then feed this article into our classifier. If you remember from when we created the fake_news feature, an output of 1 tells us we are reading fake news!
onion_vec = count_vect.transform(onion) # create bag of words
predict_onion = Naive.predict(onion_vec) # applying it to the trained model
# 1: fake news!
print(predict_onion)
What did you get? I hope your model could tell this wasn't an actual news story.
The New York Times
Let's do the same thing but this time with the New York Times. We are going to consider these articles as reputable and true. However, keep our disclaimer in mind. The New York Times is not incapable of publishing false information either.
# link: https://www.nytimes.com/2020/05/16/us/politics/linick-investigation-pompeo.html?action=click&module=Top%20Stories&pgtype=Homepage
nyt = ["""Two top congressional Democrats opened an investigation on Saturday into President Trump’s removal of
          Steve A. Linick, who led the office of the inspector general at the State Department, citing a pattern
          of “politically-motivated firing of inspectors general.” Mr. Trump told Speaker Nancy Pelosi late
          Friday night that he was ousting Mr. Linick, who was named by President Barack Obama to the State
          Department post, and replacing him with an ambassador with close ties to Vice President Mike Pence in
          the latest purge of inspectors general whom Mr. Trump has deemed insufficiently loyal to his
          administration. In letters to the White House, State Department, and Mr. Linick, Representative Eliot
          L. Engel of New York, the chairman of the House Foreign Affairs Committee, and Senator Bob Menendez of
          New Jersey, the top Democrat on the Senate Foreign Relations Committee, requested that the administration
          turn over records and information related to the firing of Mr. Linick as well as “records of all I.G.
          investigations involving the Office of the Secretary that were open, pending, or incomplete at the
          time of Mr. Linick’s firing.” Mr. Engel and Mr. Menendez said in their letters that they believe
          Secretary of State Mike Pompeo recommended Mr. Linick’s ouster because he had opened an investigation
          into Mr. Pompeo’s conduct. The lawmakers did not provide any more details, but a Democratic aide said
          that Mr. Linick had been looking into whether Mr. Pompeo had misused a political appointee at the State
          Department to perform personal tasks for himself and his wife. “Such an action, transparently designed to
          protect Secretary Pompeo from personal accountability, would undermine the foundation of our democratic
          institutions and may be an illegal act of retaliation,” the lawmakers wrote. Under law, the administration
          must notify Congress 30 days before formally terminating an inspector general. Mr. Linick is expected to
          leave his post then. Mr. Trump’s decision to remove Mr. Linick is the latest in a series of ousters aimed
          at inspectors general who the president and his allies believe are opposed to his agenda. In May, Mr.
          Trump moved to oust Christi A. Grimm, the principal deputy inspector general for the Department of Health
          and Human Services, whose office had issued a report revealing the dire state of the nation’s response to
          the pathogen. He has also taken steps to remove two other inspectors general, for the intelligence
          community and for the Defense Department. Mr. Linick was spotlighted during the impeachment inquiry when
          he requested an urgent meeting with congressional staff members to give them copies of documents related
          to the State Department and Ukraine, signaling they could be relevant to the House investigation into
          whether President Trump pressured Ukraine to investigate former Vice President Joseph R. Biden Jr. and
          his son Hunter Biden. The documents — a record of contacts between Rudolph W. Giuliani, the president’s
          personal lawyer, and Ukrainian prosecutors, as well as accounts of Ukrainian law enforcement proceedings
          — turned out to be largely inconsequential."""]
Transform this into a vector yourself and see what you get!
Solution
nyt_vec = count_vect.transform(nyt)
predict_nyt = Naive.predict(nyt_vec)
# 0: not fake!
print(predict_nyt)
Congratulations! You've trained and tested your very own text classifier!
Appendix
Next steps for this kind of project would be to write this into functions to smooth over the whole process. Allow a user to submit a link for a story, scrape the text, and feed it into the model then give an output of whether it's a factual news story or not. In addition, look up some information about tuning this model further. We can make it better by removing stop words such as articles and function words like "what". This can increase the accuracy of the model!
I hope you found this tutorial useful, and please feel free to leave a comment sharing your experience with it!
A Function to Test News With
Here's a quick function I wrote that will summarize what we did with the modeling. The only parameter is a list object containing the text in the news story!
def classifier(text):
    Naive = MultinomialNB()
    Naive.fit(X_train_counts, y_train)

    # n.b: you may need to wrap the argument in brackets to make it a vector if you passed in a string
    word_vec = count_vect.transform(text)

    predict = Naive.predict(word_vec)
    return "Fake News Story" if predict[0] else "Real News Story"
Comments (0)